 |
NextGen Workbench
The way the bioinformatics should be...
Graphs and data analysis
- Read lister
- Graphic quality representation for each individual read. Color coded.
- Sequence length distribution graph
- Per base sequence quality graph
- Per base GC content graph
- Per base sequence content graph
- Per base N content graph (integrated in the 'Per Base Content' graph)
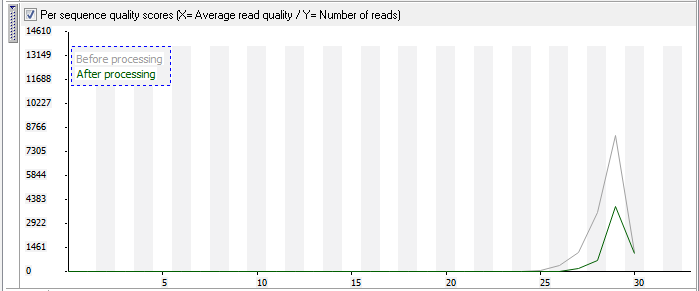
- Per sequence quality scores graph
- Graphs can be expanded to full screen
- All graphs are update in real time as the file is processed
- File statistics

|
 |

